Note: to read previous or subsequent blogs, click on the arrows at the bottom of this blog post.
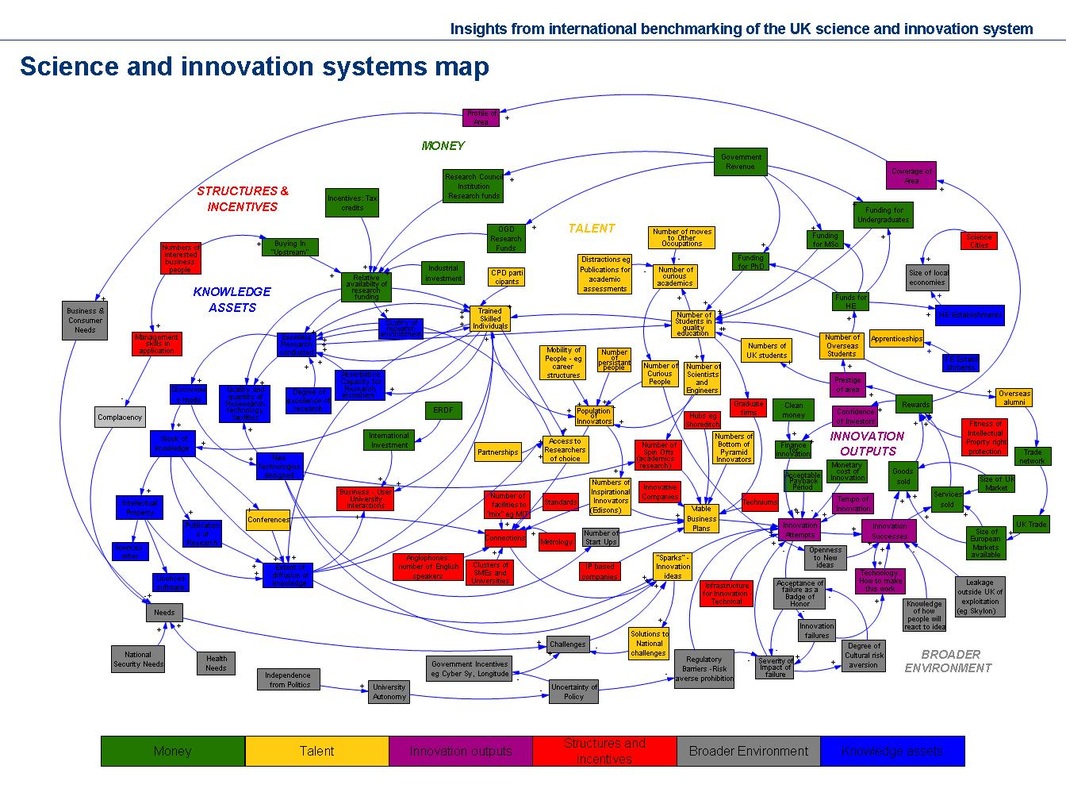
Innovation systems are complex (see illustration above). This makes them particularly difficult to measure and compare. Yet, in order to provide a grounding for our observations in the Jersey Innovation Review, we want to provide some quantitative sense of how well or poorly Jersey performs on key innovation indicators. There are a wealth of metrics out there, including from the OECD, World Intellectual Property Organisation, European Commission and the Global Entrepreneurship Monitor.
In the work for Jersey, we aim to benchmark the jurisdiction on two sets of quantitative data: available statistics and survey data. Some of the indicators we have chosen to illustrate aspects of innovation, such as new business density, are relatively easily available from existing statistics, both for Jersey and other countries (see, for example, World Bank). Others, however, will rely on the responses we receive to the Jersey Innovation Survey.
This information will allow us to analyse Jersey's performance on a number of dimensions. While the inter-connected elements in innovation systems tend to defy classification, we have devised a framework for getting to grips with the comparisons in a pragmatic way. This consists of six categories which we have called Money, Talent, Knowledge, Policy, Environment and Outputs.
Each category will encompass a number of indicators, based on both what are the most relevant metrics for Jersey innovation and whether we are able to access high-quality data on these dimensions. So for example, under Money, we will look at the degree to which Jersey businesses invest in research and development and information and communications technology. These will be assessed relative to a number of comparator jurisdictions.
The Talent category will focus both on inputs, such as investment in education, and outputs, such as the proportion of the population that has attained tertiary education and the number of degrees in science and engineering. We will also use perception-based metrics to understand whether the education system meets the needs of businesses and whether Jersey is able to attract and retain talented people from abroad.
Knowledge will cover access to science and new ideas; Policy the existing policies aimed at innovation in Jersey; Environment the broader circumstances of starting, growing and financing businesses; and Outputs the data available to assess the benefits of innovation to the Jersey economy. This last category is particularly difficult to measure, but there are proxies (such as firms' turnover derived from innovation or number of fast-growing firms) that will give us an indication of Jersey's relative performance.
To read more about how to measure innovation, for now the best place to look is probably Annex B of the report I authored in 2014 for the UK government. We have adapted the UK methodology to Jersey circumstances, created a new category to look at government policies for innovation (which were outside the scope of the UK report), and added some more up-to-date indicators. This is intentionally a more focused approach than the various international reports mentioned above.
Inevitably, the quantitative data will be imperfect and will have to be interpreted carefully. Indeed, when it comes to drawing conclusions and making recommendations, the review will rely heavily on the more qualitative information and impressions we have gained through the large number of discussions with businesses in Jersey. These will be invaluable when making sense of the numbers.

 RSS Feed